Friday, December 11, 2009

Workers Comp by Webinar and Kindle; Technology for Agencies

by Kory Wells, WorkCompEdge Blog Editor

Sometimes we think of technology only as an expense, but when it's well-implemented, it can be an effective time and money saver. Today's blog features news about a cost-effective work comp webinar at which you can train a room full of people at one low price; Kindle delivery of our blog; and a free newsletter that will bring you more technology tips on a regular basis.

Interested in workers compensation training?


Better understand - and communicate with others about - the experience rating mod, premium overcharges, expected loss rates, loss runs, and more. Our friend Bill Wilson, Director of the Big "I" Virtual University (VU), will be offering a Workers Compensation Experience Rating Webinar on January 14, 2010, from 2:00 - 4:00 p.m. EST. We heartily recommend that you check it out (and no, we don't receive any type of compensation for making that recommendation).

Please view the full blog at http://workcompedgeblog.com/

Wednesday, December 2, 2009

More Details on the Significance of the 1/1/2010 California Workers Compensation Experience Rating Plan Changes

by Jeff Adcock, FCAS, MAAA, Consulting Actuary, SIGMA Actuarial Consulting Group

Editor's note: This is our final and most detailed article in a series on the 1/1/2010 changes in the California workers compensation experience plan rates and rules. It explains more about the key factors we summarized in our previous post, California 1/1/2010 Mod Calculation Change Advisory.


As you probably know from our previous blog entries, the Workers' Compensation Insurance Rating Bureau of California (WCIRB) pure premium filing with effective date 1/1/2010 proposed a 22.8% increase in the pure premiums, or filed loss cost benchmarks. In early November, the insurance commissioner rejected the proposed rate increase and ordered no change in the pure premiums overall, although individual class codes did see shifts.

The filing also proposed significant changes to the California Workers Compensation Experience Rating Plan (ERP), primarily driven by recommendations of the Experience Rating Task Force. The insurance commissioner accepted the proposed changes to the ERP, with the caveat that the Expected Loss Rates (ELRs) originally filed should be modified by 1% to maintain the same experience rating off-balance factor of 1.030 that was underlying the 1/1/09 pure premiums.

The following summarize the significant changes to the ERP effective 1/1/2010:
  1. Changes/enhancements to the methodology for calculating the ELRs.
  2. Use of a single split point of $7,000 to segregate individual claims into primary and excess components, in lieu of the current formula for splitting claims.
  3. Changes to the D-Ratios and Credibility Values (“B” and “W” values) to reflect the adoption of a primary/excess split point of $7,000 and to reflect recent frequency and severity trends.
  4. Increase in the experience rating eligibility threshold from $15,700 to $16,300 to reflect wage inflation.
The WCIRB states in its executive summary of the filing that “based on the proposed methodology change, the impact should be relatively minor for the overwhelming majority of experience rated employers”. However, based on the several moving parts above and particularly the significant changes in the ELRs for many class codes, it is our opinion that the experience modification factor for more than just a small minority will change. That’s why we believe it is more important than ever to consider in advance the impact these changes will have on a specific client, particularly those that must maintain an experience modification factor below a particular number. Now let’s explore these changes, and the mod trends we've seen in our analysis, in more depth.

Changes/Enhancements to the Methodology for Calculating ELRs

The WCIRB recommended changes to the calculation of the ELRs based on
  • the final report of the Experience Rating Task Force and
  • hindsight studies that showed ELRs for some groups were consistently higher or lower than indicated by actual experience.
The most significant change was using adjustment factors based on and grouped in accordance with the North American Industrial Classification System (NAICS). The following table taken from the WCIRB January 1, 2010 Pure Premium Filing (page B:C-12), shows the impact by NAICS group related only to the change in calculating adjustment factors at the NAICS group level:
Table 1: Approximate Impact of Recommended Methodology Changes on January 1, 2010 Expected Loss Rates
NAICS Sector Grouping
NAICS Sector Grouping Description
Approximate Expected Loss Rate Impact
11 & 21
Agriculture & Mining
+1.8%
22 & 23
Utilities & Construction
-7.1%
31
Manufacturing
+2.3%
42
Wholesale
+2.3%
44
Retail
+0.7%
48
Transportation & Warehousing
+0.5%
51
Information
+2.3%
52
Finance & Insurance
-0.5%
53
Real Estate
+15.9%
54
Professional Services
+2.1%
56
Administrative
+6.5%
61
Education
+7.3%
62
Health
+1.4%
71
Arts & Entertainment
+15.0%
72
Hospitality
+4.2%
81
Other
-5.0%
8742
Outside Sales
-12.2%
92 & 8810
Clerical & Public Administration
-4.1%
Again, the above estimated impacts reflect only the change in the methodology related to the adjustment factors. The ELRs effective 1/1/2010 also changed based on actual loss experience, of course. The individual class codes use between two and five years of policy year data (2002 through 2006) to calculate the indicated limited loss to payroll ratios which are the basis for the ELRs. For individual class codes, policy year 2006 rolling into the data while an older year rolls off may also have a significant impact.

The table below shows the change from 1/1/2009 to 1/1/2010 in the ELR for the 20 largest class codes by payroll. So for example, for class code 8742, even though the new methodology led to an expected decrease in the ELR of 12.2%, the actual change in the ELR including the impacted of updated experience in the filing, was a decrease of 20.0%.
Change in the ELR for 20 largest class codes in California based on 2006 payroll:
Class
Code
Number

Class
Code
Description

2006 Payroll
ELR
Effective
1/1/2010

ELR
Effective
1/1/2009

ELR
%
Change

8810
Clerical Office Employees
Draftspersons
Libraries — librarians or professional assistants
Libraries — public
136,415,539,366
0.18
0.21
(14.3)%
8742
Salespersons — Outside
Bookbinding — Salespersons — Outside
Boy and Girl Scout Councils — executive secretaries
Newspaper Publishing or Newspaper Printing — reporters, advertising
Printing —Salespersons — Outside
35,047,398,931
0.20
0.25
(20.0)%
8859
Computer Programming or Software Development
Internet or Web-Based Application Development or Operation
22,273,831,140
0.07
0.07
0.0 %
9079
Restaurants or Taverns
Vending Concessionaires
12,756,678,084
1.43
1.36
5.1 %
8834
Physicians
11,581,691,389
0.55
0.61
(9.8)%
8820
Attorneys
9,349,385,502
0.20
0.21
(4.8)%
8017
Stores — retail
Stores — hardware — retail
Towel or Toilet Supply Companies
Product Demonstrators and Sample Distributors — by contractors — in stores
9,283,425,404
1.49
1.46
2.1 %
8808
Banks
7,877,334,077
0.29
0.34
(14.7)%
8868
Colleges or Schools — private — academic professionals
6,724,807,252
0.45
0.45
0.0 %
8741
Real Estate Agencies
6,637,524,359
0.08
0.06
33.3 %
8803
Auditors or Accountants
5,580,897,170
0.14
0.14
0.0 %
8822
Insurance Companies
5,403,413,749
0.32
0.41
(22.0)%
8601
Engineers — consulting
Oil or Gas Geologists or Scouts
Geophysical Exploration
4,856,913,985
0.38
0.37
2.7 %
3681
Instrument Mfg. — electronic
Computer or Computer Peripheral Equipment Mfg.
Telecommunications Equipment Mfg.
Audio/Visual Electronic Products Mfg.
4,593,377,471
0.63
0.66
(4.5)%
8018
Stores — wholesale
3,844,316,702
2.58
2.52
2.4 %
7610
Radio, Television or Commercial Broadcasting Stations
3,588,314,397
0.45
0.39
15.4 %
8830
Institutional Employees
3,403,364,192
0.89
0.85
4.7 %
9043
Hospitals
3,403,364,192
0.89
0.85
4.7 %
9610
Motion Pictures — production — all employees
3,335,051,000
0.77
0.92
(16.3)%
8391
Automobile or Automobile Truck Dealers
3,306,056,911
1.51
1.54
(1.9)%
PDF documents listing all class codes and their ELR and D changes, sorted three different ways, are available below

Sorted by Class Code Number

Sorted by Payroll (highest to lowest)

Sorted by Percentage Change in ELR between 1/1/2009 and 1/1/2010

Since most risks have several class codes, the impact on the individual risk will depend on the mix of payroll by class code. It's interesting to note that 116 out of 500 class codes, representing almost 50% of the total payroll in the state, have decreases of over 10% in the ELR from 1/1/2009 to 1/1/2010. 96 out of 500 class codes, representing less than 10% of the total payroll in the state, have increases of over 10% in the ELR from 1/1/2009 to 1/1/2010.

Impact of Change to a Primary Split Point of $7,000 per Claim

The ERP effective 1/1/2010 defines the primary loss amount as the actual loss amount capped at $7,000. Contrast that with the prior method of calculating the primary loss using the formula (9,000 x Total Loss) / (Total Loss + 7,000). A single split limit was recommended to simplify the experience rating formula and to be consistent with the experience rating formula used in other states. While the split limit in most states is $5,000, the limit amount of $7,000 limit was selected to minimize the impact, in total, of the change in formula. As noted on page B:C-35 of the WCIRB January 1, 2010 Pure Premium Rating Filing, based on the 2006 policy year projection, the D-Ratio for the $7,000 split is 0.203 and the D-Ratio based on the old formula is 0.199. So the change in the formula had minimal impact on the overall D-Ratios.

Even though the intent of the plan is neutrality in terms of the split of losses between primary and excess, the impact on individual losses varies. The table below summarizes the impact on the actual primary losses included in the experience rating formula for several individual loss amounts.
Change in primary losses for various loss amounts, old vs. new split method
Loss
Prior Method
Method Eff. 1/1/2010
% Change in
Amount
Primary
Excess
Primary
Excess
Primary Loss
2,000
2,000
0
2,000
0
0.0 %
2,500
2,368
132
2,500
0
5.6 %
5,000
3,750
1,250
5,000
0
33.3 %
6,000
4,154
1,846
6,000
0
44.4 %
7,000
4,500
2,500
7,000
0
55.6 %
10,000
5,294
4,706
7,000
3,000
32.2 %
15,000
6,136
8,864
7,000
8,000
14.1 %
20,000
6,667
13,333
7,000
13,000
5.0 %
24,500
7,000
17,500
7,000
17,500
0.0 %
25,000
7,031
17,969
7,000
18,000
(0.4)%
30,000
7,297
22,703
7,000
23,000
(4.1)%
40,000
7,660
32,340
7,000
33,000
(8.6)%
50,000
7,895
42,105
7,000
43,000
(11.3)%
75,000
8,232
66,768
7,000
68,000
(15.0)%
100,000
8,411
91,589
7,000
93,000
(16.8)%
125,000
8,523
116,477
7,000
118,000
(17.9)%
150,000
8,599
141,401
7,000
143,000
(18.6)%
175,000
8,654
166,346
7,000
168,000
(19.1)%
Losses less than $24,500 are included at higher amounts in the primary layer and therefore lead to an increase in the experience mod factor, all else being equal. Losses greater than $24,500 are included at lower amounts in the primary layer and therefore lead to a decrease in the experience mod factor, all else being equal.

Impact of Changes in the Credibility Values (“B” and “W” Values)

The last significant change to the ERP effective 1/1/2010 is the impact of the updated credibility values – calculated as a function of the Ballast (“B”) and Weighting (“W”) values. The current “B” and “W” values were adopted effective 1/1/1997, so it has been a significant amount of time since those have been updated. In the 13 years in between, claim frequencies have decreased and claim severities have increased.

The decrease in claim frequencies and the increase in claim severities are reflected in the approved “B” and “W” values effective 1/1/2010. The primary credibility, which is a function of the “B” and “W” values, increased by over 20% for risks with total expected losses (limited to $175,000 each) of between 11,820 and 40,147 during the experience period. Risks with total expected losses (limited to $175,000 each) of greater than 40,147 have primary credibility of 100%. With the prior “B” and “W” values, a risk needed expected losses of over $1.4 million for full primary credibility.

The higher the primary credibility, the greater the impact of the actual loss experience of the risk. Higher primary credibility will raise the experience mod on a risk with primary losses greater than expected primary losses. Conversely, higher primary credibility will lower the experience mod on a risk with primary losses less than expected.

The excess credibility has decreased on risks with expected losses (limited to $175,000 each) greater than $708,762.

Bottom Line of Impact of Changes to ERP Effective 1/1/2010
  1. Change in ELRs - ELRs decreased by 6.4% in total, due to change in methodology and actual experience. 116 out of 500 class codes, representing almost 50% of the total payroll in the state, have decreases of over 10% in the ELR from 1/1/2009 to 1/1/2010. 96 out of 500 class codes, representing less than 10% of the total payroll in the state, have increases of over 10% in the ELR from 1/1/2009 to 1/1/2010.
  2. Change in primary loss “split amount” – The move to a fixed amount of $7,000 per claim leads to individual losses less than $24,500 being included at higher amounts in the primary layer and increases the experience mod factors, all else being equal. Losses greater than $24,500 will be included at lower amounts in the primary layer and therefore decrease the experience mod factors, all else being equal.
  3. Change in credibility values (“B” and “W” values) – Credibility factors related to the primary layer have mostly increased, and full primary credibility (i.e. 100% primary credibility) is now given to all risk with total expected losses (limited to $175,000 per claim) of $40,147. This increase in credibility will lower the experience mod for risks with primary loss experience less than expected. The opposite will occur for risk with primary loss experience greater than expected.


Question: Why did the WCIRB file for a 22.8% increase in pure premiums, but ELRs decreased approximately 6.4%? Aren’t they related, and shouldn’t the ELRs be increasing in line with proposed pure premiums?

WCIRB filed the 22.8% increase in pure premiums and the decrease in ELRs effective 1/1/2010 at the same time. It should be noted that the ELRs were later adjusted by 1.0% to take into account the impact of the experience rating off-balance.

There are probably a variety of factors at work including:
  • the impact of reforms (the 2010 modification factors use 2006 through 2008 which are all post-reform)
  • slight differences in indications based on policy year data used in setting the ELRs and the accident year data used in determining the overall pure premium increase
  • the future impact of the Ogilvie and Almaraz/Guzman decisions
However, the main reason the indicated change in the ELRs and pure premiums are so different seems to due to the way the insurance commissioner has handled each in the past few rate decisions. While the insurance commissioner has not always approved the increase in the pure premiums proposed by the WCIRB, he has typically approved the changes (most increases) in the ELRs with only minor adjustments due to the impact of changes in the expected off-balance amount.

For example, as of 1/1/2009 the WCIRB filed for a 16.0% increase in pure premiums. The insurance commissioner approved a 5.0% increase in pure premiums but accepted the ELRs with only a 1% modification based on the off-balance factor change.

Question: Are certain mods more likely to increase as a result of these rate and rule changes?

While there are clearly no hard and fast rules about how a particular mod will change under the new rules, we have observed these trends in our analysis:
  • For insureds with a mod above or below 1.00, the new mod formula will increase the gap from 1.00.
  • For insureds with a high frequency rate - that is, numerous losses under the 7,000 split point - the new mod formula will increase the mod.
  • For insureds with high severity - that is, relatively few losses greater than the 7,000 split point - the new mod formula will show little change.
  • The new mod formula will penalize the smaller insureds while having minimal impact on the larger insureds.
We'd love to hear from you. Let us know if your experience and observations with mods under the new California rates and rules coincide with our analysis.

Friday, November 20, 2009

California 1/1/2010 Mod Calculation Change Advisory

by Kory Wells with Jeff Adcock and Tony King

ModMaster update 09.11, available to our clients on Friday, November 20th, includes support for the California rates and the split calculation change recently approved by the California insurance commissioner, effective 1/1/2010. If you do business in California - whether you use ModMaster or not - you need to be aware of how these changes may affect your or your client's workers compensation mod.

Our actuaries have been analyzing the data, and it's going to take us a few more days to get more details in a form to share with you. (Don't miss our previous post that excerpts the WCIRB summary of changes.) But we wanted to go ahead and alert you to a few key principles that may affect your mod under the new rules:

1. Our actuaries have determined that, on average, expected loss rates (ELRs) have decreased 6.4%. In fact, over 100 payroll codes had ELR decreases of 10% or more. While your results will depend entirely on the mix of payroll codes in your mod, an overall decrease in ELRs means that, if everything else stayed the same in your mod, you would have a good chance for your mod to increase in 2010.

2. An important loss level to keep in mind is $24,500. Under the new primary/excess split method, losses under $24,500 will have a greater primary value than they did under the old method. Since primary losses affect the mod more than excess losses do, this is another factor that may drive your mod up, especially if you tend to have more smaller losses than very large losses. Losses over $24,500 will generate a lesser primary value than they did under the old method, so if you have only losses over $24,500, this may benefit your mod.

3. The best defense is to be prepared for a mod increase, and a good way to do that is to compute your old mod with the new rates and split method. In ModMaster, this is easy to do (remember, you must be on update 09.11, code level 091118, or later):
  • Select the desired mod file with a 2009 effective date, and note the current mod value. Use the Utilities/Copy feature to make a copy of the file with a new name.
  • On the Company Setup page, change the effective date to 1/1/2010. Don't worry that this isn't the policy anniversary date, and don't change any other policy dates or other data.
  • Calculate the mod and see what the 2010 value would be. You may want to look at your favorite ModMaster reports for the 2009 vs. 2010 files side-by-side, but don't forget that the Mod Comparison report will do a quick comparison for you.
Of course, in the real world, your 2010 mod will have different payroll and loss amounts due to the oldest policy period leaving the experience period and the new policy period coming in. In the real world, there are also a lot of other moving parts to the mod formula aside from the ELRs and the primary/excess split values. Certainly not everyone is going to see a mod increase, and some entities will see a decrease. But our testing and analysis has revealed some cases of attention-getting mod increases.

More details of our analysis are forthcoming. In the meantime, we'd love to hear from our users how the 2010 changes appear to impact the mod files they run with a 1/1/2010 effective date in ModMaster.

Wednesday, November 18, 2009

How Will the 1/1/2010 California Workers Compensation Split Formula Change Impact the Mod?

by Kory Wells with Jeff Adcock

The fact that California Insurance Commissioner Poizner has once again rejected an increase in workers compensation pure premium rates (read the November 10th Insurance Journal article California's Poizner Rejects Workers' Comp Increase Request, Again) is almost overshadowing the fact that he approved other changes that will interest workers compensation agents and others advising clients in the work comp arena.

As stated in the WCIRB's November 9th announcement:
The Insurance Commissioner approved amendments to the USRP include changes to the Standard Classification System and the elimination of the requirement of insurers to report social security numbers due to privacy concerns. The approved amendments to the ERP include (a) changes to the eligibility threshold, (b) classification expected loss rates, (c) the split formula used to segregate individual claims into their primary and excess components and (d) the ERP credibility ("B" and "W") values.
This announcement undoubtedly prompts questions such as:

How will these changes to the California rating plan affect the mod?
Part B of the 2010 Regulatory Filings posted on the WCIRB site goes into the changes and their anticipated impact in great detail. A brief summary (emphasis ours) lies in this sentence from page B:C-12:
While this methodological enhancement will improve the accuracy of experience modifications, the 2010 experience modifications for some employers will be impacted.
For those of you who are interested in learning more about the anticipated impact on the expected loss rates and the mod, we've packaged an excerpt of Part B in pdf form.

The first page (B:C-12) of the excerpt has a chart showing the impact on expected loss rates (not the mod itself) by industry sector that may be of interest. As you can see, real estate, arts and entertainment, and outside sales are some of the areas where the expected loss rates will change the most, with utilities and construction, education, and administrative also showing fairly significant impacts.

The second page (B:C-36) of the excerpt makes it clear that while the overall statewide average mod is NOT going to change, there will be some variability. The following pages, Exhibits 2.1 through 2.7, show the expected variation in the mod by size of account as measured by expected losses (Exhibits 2.1 through 2.5) and then by existing mod (Exhibits 2.6 and 2.7).

One of our actuaries, Jeff Adcock, consolidated the exhibit data into this spreadsheet (also available in pdf format) so you can have a one-page overview of the estimated impacts. The interesting thing about the existing mod analysis is how current risks with a mod of over 1.00 have a higher percentage of anticipated increase. Jeff is continuing to study the WCIRB documentation and may provide further analysis here on this blog, as warranted.

When will these changes be available in ModMaster?
The change in the split formula requires a ModMaster programming change. We were already working on this change prior to the commissioner's approval and now have it in testing. This change - along with the new expected loss rates and B and W values - should be available within a couple of weeks.

In the meantime, if you already have 2010 California mods that you could share with us for testing purposes, we'd certainly appreciate you doing so - contact support for more information.

Friday, November 6, 2009

Training Videos Help Address OSHA's Top 10 Safety Violations for 2009

by Kory Wells, WorkCompEdge Blog Editor

As reported on several news and blog sites in the past several days, OSHA has recently released its preliminary list of top safety violations for 2009. As stated in the full release on PRNewsWire, which came from the National Safety Council,
The number of top 10 violations has increased almost 30 percent over the same time period in 2008.

"We appreciate our colleagues at OSHA presenting their new violation data to such a receptive audience," said National Safety Council President and CEO Janet Froetscher. "The sheer number of violations gives us new resolve in raising awareness about the importance of having sound safety procedures."
"So what's up with the 2009 spike in OSHA safety violations? Have layoffs, emotional states, and other fallout from the financial crisis stressed workers to the point of making bad safety decisions? Or have the OSHA inspectors just been especially diligent this year?"growth

So what's up with this spike in violations? And will this correlate to an actual increase in workers comp claims in 2009, something we suggested might happen when the global financial meltdown occurred? We're not saying we told you so...we're wondering along with you what's going on. Have layoffs, emotional states, and other fallout from the financial crisis stressed workers to the point of making bad safety decisions? Or have the OSHA inspectors just been especially diligent this year? Regardless of the cause, as Ms. Froestscher points out, clearly there's a need to mitigate this trend.

So, this is a good time to remind you of the WorkCompEdge Safety Training Center, which allows each of a company's employees to take web-based video courses on desired subjects, answer a quiz at the end of each course, and, if he or she earns a passing grade, receive a certificate of completion for that subject. With over 40 videos on a diverse set of safety topics, including defensive driving, disaster planning, hazard communication, noise and hearing protection, recordkeeping, and more, it's sure to have something for everyone - and addresses much of the top 10 list of violations. Here's the list, along with the related video(s):

1. Scaffolding - 9,093 violations
Scaffold accidents most often result from the planking or support giving way, or from the employee slipping or being struck by a falling object.

See the WorkCompEdge Safety Training Center video Scaffolds in Construction

2. Fall Protection - 6,771 violations
Any time a worker is at a height of four feet or more, the worker is at risk and needs to be protected. Fall protection must be provided at four feet in general industry, five feet in maritime, and six feet in construction.

See the WorkCompEdge Safety Training Center video Fall Protection in Construction

3. Hazard Communication - 6,378 violations
Chemical manufacturers and importers are required to evaluate the hazards of the chemicals they produce or import and prepare labels and safety data sheets to convey the hazard information to their downstream customers.

See the WorkCompEdge Safety Training Center video Hazard Communication. Note that there's a separate Hazard Communication for Healthcare Workers video.


4. Respiratory Protection - 3,803 violations
Respirators protect workers against insufficient oxygen environments, harmful dusts, fogs, smokes, mists, gases, vapors, and sprays. These hazards may cause cancer, lung impairment, other diseases, or death.

See the WorkCompEdge Safety Training Center video Respiratory Protection

5. Lockout-Tag out - 3,321 violations
“Lockout-Tag out” refers to specific practices and procedures to safeguard employees from the unexpected start up of machinery and equipment, or the release of hazardous energy during service or maintenance activities.

See the WorkCompEdge Safety Training Center video Lockout-Tagout - Authorized Employee

6. Electrical (Wiring) - 3,079 violations
Working with electricity can be dangerous. Engineers, electricians, and other professionals work with electricity directly, including working on overhead lines, cable harnesses, and circuit assemblies. Others, such as office workers and sales people, work with electricity indirectly and may also be exposed to electrical hazards.

This violation is in part addressed in the WorkCompEdge Safety Training Center videos Electrical Safety - Unqualified Worker and Arc Flash Safety


7. Ladders - 3,072 violations
Occupational fatalities caused by falls remain a serious public health problem. The U.S. Department of Labor (DOL) lists falls as one of the leading causes of traumatic occupational death, accounting for 8% of all occupational fatalities from trauma.

See the WorkCompEdge Safety Training Center videos Slips, Trips, and Falls and Fall Protection in Construction

8. Powered Industrial Trucks - 2,993 violations
Each year, tens of thousands of injuries related to powered industrial trucks (PIT), or forklifts, occur in U.S. workplaces. Many employees are injured when lift trucks are inadvertently driven off loading docks, lifts fall between docks and an unsecured trailer, they are struck by a lift truck, or when they fall while on elevated pallets and tines.

See the WorkCompEdge Safety Training Center videos Forklift Operator Safety and Introduction to Rough Terrain Forklift Safety

9. Electrical (general) - 2,556 violations
See #6.

10. Machine Guarding - 2,364 violations
Any machine part, function, or process that may cause injury must be safeguarded. When the operation of a machine or accidental contact injures the operator or others in the vicinity, the hazards must be eliminated or controlled.

See the WorkCompEdge Safety Training Center video Machine Guarding

Registration for the Safety Training Center is located in the Download and Online Tools section of the "Four" Safety module of WorkCompEdge. There are several other tools there that may also help improve your company's safety culture and record, including a safety commitment statement, a safety culture survey, a safety measurement tool, and more.

Let us know what you think about the increase in violations this year, and other ideas for addressing this issue.

Wednesday, October 21, 2009

Comparing Two Workers Compensation Experience Mods

by Kory Wells, WorkCompEdge Blog Editor

Many of our readers have found themselves, at one time or another, in the unfortunate position of trying to explain why the workers compensation mod went up from the previous experience period. The possible culprits are numerous and have a lot of moving parts: changes in
  • expected loss rates,
  • payroll,
  • overall loss experience, or
  • the mix of loss types (frequency, severity and/or medical-only losses)
all contribute to a change in the mod. Of course, a change can be positive or negative depending on all the moving parts. Mod increases will occur, even if loss levels remain the same, if expected loss rates fall. Business owners don't expect to pay more in premium when their business is down, but it's definitely possible. So how do you get a handle on what exactly is influencing a mod - and premium costs - from one experience period to the next?

We know you already use ModMaster to calculate and analyze the experience mod calculation (What? You don't? Learn more about ModMaster now), so in the past you would've undoubtedly used one of our many reports - perhaps the Loss Analysis by Policy Period, for example - to help see what's happened with the mod from one rating effective date to the next. Still, that involved selecting the desired mod file and requesting the desired reports, then opening up the mod file for the previous experience period and requesting those reports. So much paper and time and looking back and forth from one page to another.

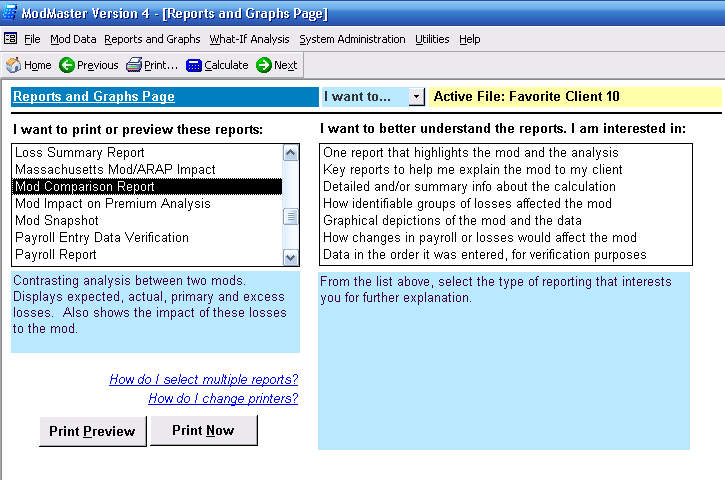
Find the new Mod Comparison report on the Reports and Graphs page of ModMaster.

But now (drum roll, please), that's all changed. The new Mod Comparison Report, available in ModMaster update 09.08 and later, produces a two-page report that shows critical information for both the current mod file and a second mod file of your choice. Here's how to use this report for best results:

1. First, let's say that you have the 2009 mod for Favorite Client already loaded into ModMaster. You're ready to put in data for the 2010 mod. Start by doing a File Utilities/Rollover of the Favorite Client 2009 to a new name, let's say Favorite Client 2010. This deletes the oldest policy year of data (in this case the 2005 policy year) and "scoots" all the other data over on the payroll and small loss pages so that the newest column is empty and awaits your data input.

2. Input payroll and loss data (either estimates or actuals, if you have the data) for the newest policy data into the Favorite Client 2010 file. This would be the 2008 policy period for our example. Also make any other adjustments to existing payroll or losses to match the bureau worksheet.

3. Calculate the mod. If there are no errors, then proceed to the Reports Menu.

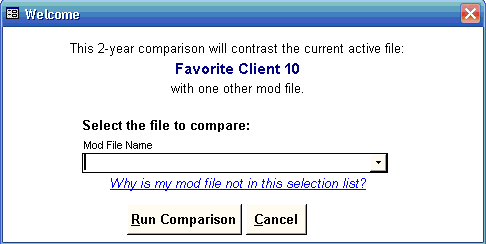
4. You'll see that the Mod Comparison report is now a choice on the Reports Menu. When you click on this report and then click "Print Preview" or "Print Now," the following dialog appears:

Mod Comparison report dialog

5. Now, here's the important part: when you pull down the list of mod files, be sure to select the mod file for the same risk but only one year earlier. While ModMaster will attempt to compare any two files you indicate, this report is designed to compare mods that differ by one and only one experience period. If you try to compare other mods, unpredictable results may occur, as we say in the software business.

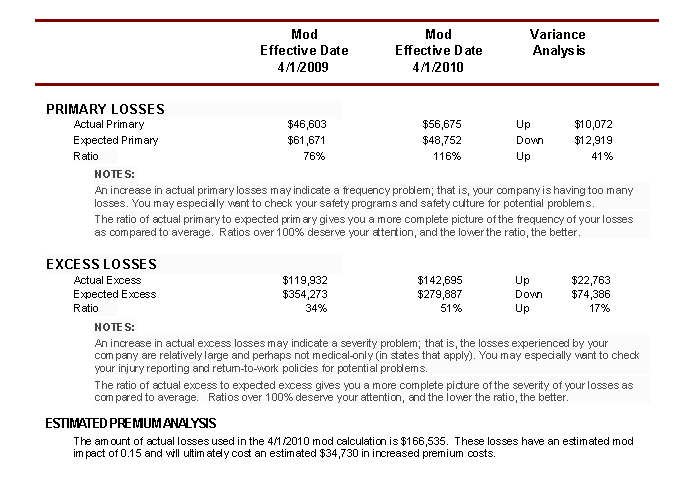
6. After you select the mod file to compare to, click the "Run Comparison" button, and something like the following will print or preview. (Click the report image to view the report as a pdf.)


Mod Comparison sample report, page 1

Mod Comparison report, page 2

At a glance, you can see how much the mod changed from year to year, but just as importantly, how much the minimum and controllable mods have changed. You can also see what's happened with the expected and actual losses: whether they've gone up or down, and what's happening with actual to expected ratios.

In this case, we can see that the mod went up, not only because expected losses were down but also because the actual losses which dropped out of the calculation were less than the actual losses which were added for the 2008 policy period.

The new Mod Comparison report is based on a user suggestion we greatly appreciate. We've already had a new suggestion from a different user that we should also list payroll totals, not just expected losses. Give the report a try today and let us know what you think!

Wednesday, October 7, 2009

Take Our Collateral Survey

by Kory Wells, WorkCompEdge Blog Editor

As a follow-up to Michelle Bradley's recent blog article "A 2009 Collateral Perspective," we've decided to conduct a survey of professionals currently involved in collateral issues related to self-funded workers compensation liabilities.

We invite insurance brokers, risk management consultants, and risk management staff of self-funded concerns to participate in the survey, which will be open through the month of October.

The goal of the survey is to assess, on a national basis, trends in collateral negotiations, exposures, reviews, arbitration, litigation, and other factors that SIGMA has seen with its own clients this year.

Our privacy policy: At the end of the survey, we ask you to register if you'd like us to share survey results directly with you. We'll also be posting at least some of the survey results on this blog and possibly in other venues. If you supply your email address, we'll also send you an invitation to join our newsletter list. We will NOT be sending any other emails or contacting you further, nor will we share your personal data with anyone else. Also, no personally identifiable information will be shared in any survey results we publish.

The survey takes about 5 minutes to complete, and (enticement alert) you get not one, but two, special free offers at the end. Take our collateral survey now.

We appreciate your participation!

Wednesday, September 23, 2009

Improve Your Cash Flow with Pay-As-You-Go Workers Comp

by Frank Pennachio, WorkCompEdge Regular Contributor

Workers compensation policy premiums are usually based on estimated payrolls. The final earned premium is determined during a premium audit after the policy expires and is based on actual payroll. When payroll is higher than estimated, the employer owes additional premium, and when payrolls are lower than estimated, money is returned. In current economic conditions, many employers’ payrolls are declining, so an employer may be paying higher than necessary monthly installments due to an overstated payroll estimate at the inception of the policy.
paywindowIn these challenging times where cash flow is king, employers might want to consider another work comp insurance option known as Pay-As-You-Go.
View the full blog at http://workcompedgeblog.com/

Wednesday, September 9, 2009

A 2009 Collateral Perspective

by Michelle Bradley, SIGMA Actuarial Consulting Group

In October 2006, Lloyd Kelly and I authored a paper titled “Reducing Collateral Uncertainty: A Primer for Negotiations” that was published in Risk Financing Perspectives for the International Risk Management Institute. We expanded the paper in 2008 and published it as “Reducing Collateral Uncertainty” for the Institute’s Risk Financing Manual.

financials
For the purposes of this article, collateral is one type of security that can be provided to a fronting carrier or regulator by a self-insured entity for the credit risk assumed by the carrier or regulator.
View the full blog at http://workcompedgeblog.com/

Wednesday, August 19, 2009

New WorkCompEdge Licensing Options

As you may recall, we launched WorkCompEdge last fall - just in time for the economic crisis. Since the downturn affected many sectors, including insurance and risk management, we've been especially grateful to our WorkCompEdge founding members and to all of our ModMaster customers who evaluated WorkCompEdge. Time and again, we've heard similar feedback, however, and that's led us to make some changes to our WorkCompEdge licensing options we think you'll be excited about. Here are the highlights:


Our new Agency Plus license represents some cool savings over previous WorkCompEdge license options for agencies and similar providers. Thanks for giving us your feedback!

IF YOU ARE AN AGENCY, BROKERAGE, INSURANCE COMPANY, CONSULTANT, PEO, TRUST, ETC.

For only $1,000 per year, the new and very affordable WorkCompEdge Agency Plus license offers agencies and similar providers the opportunity to access WorkCompEdge for internal training and coordination of service activities in 15 different areas that affect work comp costs, including:

* hiring practices,
* safety,
* the premium audit,
* mod verification and analysis,
* medical clinic relationships,
* return-to-work,
* and much more.

As you probably know if you're a regular reader of this blog, site access includes to-the-point educational modules PLUS strategy and tools to help you evaluate a company's entire work comp picture.

For an additional $500 per client, you can add the option for your clients to have direct access to WorkCompEdge and the WorkCompEdge Safety Training Center.

The Agency Plus license can be purchased as an add-on to your annual ModMaster subscription, or you can contact us for a prorated license until the time your subscription is due for renewal.

IF YOU ARE INTERESTED IN AN AREA "EXCLUSIVE" LICENSE TO WORKCOMPEDGE

For agencies who are eager for exclusive access to the benefits and competitive advantage of WorkCompEdge, we've enhanced the Member Agency Exclusive license to include custom marketing support, flexible employer seats, unique educational opportunities, and more. A number of our founding members have already converted to this license, which is priced at $850 per month. Some markets - including Albuquerque, Atlanta, Buffalo, Shreveport, and parts of Maryland, Minnesota, and Wisconsin - are already closed.

IF YOU'RE AN EMPLOYER

WorkCompEdge is still available through your favorite agent, broker or consultant on terms they specify. It's also available directly from us for $500 per year.

FAQs

Q: If someone else gets an exclusive license in my area, does that affect my ModMaster subscription?

A: Absolutely not. It only affects your ability to be a registered WorkCompEdge user. You will still be an important ModMaster client, participate in our forthcoming WorkCompWisdom program, and glean valuable knowledge from our blog and other resources.

Q. Exactly what are the fifteen modules in WorkCompEdge?

A. A graphic showing all of the modules is at http://www.specificsoftware.com/wce/videointros.htm. Click on any of the module titles to see the short video introduction to that module. At $1,000, we believe you'll get your money's worth by using even ONE of these modules!

MORE DETAILS

Learn more about the new WorkCompEdge license options at http://www.specificsoftware.com/wce/pricing.htm

If WorkCompEdge interests you, act soon! To order or inquire further, contact Helene Pellett at 800-929-4052 x 205 or helene_pellett@specificsoftware.com

Wednesday, August 5, 2009

LinkedIn: Your Objections, and Why You Should Get Over Them Now

We’re grateful that several hundred of our readers and clients took the time to participate in our recent survey “How Do You Stay Informed and Connected?” We’re still compiling the results, but for today, I want to focus on one trend that was glaringly evident: professionals in the insurance industry (which made up 98% of our respondents) are not taking advantage of social media sites like LinkedIn and Twitter. Now, admittedly, Twitter is still pretty new, so it may be understandable that more folks in the insurance industry haven’t yet experimented with it. But LinkedIn? A whopping 85% of our respondents say they’re not using LinkedIn. While we understand that social media may not be for everyone, at least exploring the possibilities - particularly if you are in business-to-business (b2b) sales or service - should be an objective for every business, period. So let's talk more about LinkedIn today.
Here are some common reasons our respondents said they’re not using LinkedIn

Connect with our CEO Tim Coomer or blog editor Kory Wells on LinkedIn.

Thursday, July 23, 2009

Take Our Survey: How Do You Stay Informed and Connected?


Several years ago, Specific Software conducted a survey about favorite online sources of insurance and risk management news and information. The survey garnered some media attention in the industry and was useful to us internally as we developed marketing and publicity plans.

You can now follow WorkCompEdge on Twitter!


But that was a few years ago! With the growth of both content and "2.0" applications on the web, we've decided it's time to resurrect the survey, with a few new questions geared towards not just information, but how you stay connected with colleagues and clients.

Whether you're an insurance or risk management professional or a business insurance consumer, please take our survey "How Do You Stay Informed and Connected?" now.

While I'm on the topic of staying connected, this is a good time to mention that you can now follow WorkCompEdge on Twitter. I'm trying to tweet at least once a day with some sort of information about workers comp, general insurance and risk management, general business or technology news, or news about Specific Software and SIGMA Actuarial that I hope others may find interesting.

You can use Twitter for free simply through the Twitter website - using your cell phone is optional. I've found that starting just by using the web interface is a good, low-impact way to try it out.

In general, the insurance industry doesn't seem to be embracing social media as quickly as other industries. But numerous activities, such as the recent AMS Users' Group Social Media Road Trip, Insurance Journal's promotion of social media webinars, and consultant Rick Morgan's blog entry "Insurance Agents Don't Market," suggests that we are on the cusp of change when it comes to how we connect with each other and our clients.

We'd love to hear your thoughts in our survey - and in the blog comments!

Wednesday, July 8, 2009

How Will New NCCI Ratemaking Rules Affect Workers Comp Mods?


It's a bit confusing to understand the likely impact of the new NCCI ratemaking change. But businesses, such as contractors, which are required to have a mod of 1.0 (or other value) in order to bid on jobs will want to be especially careful to anticipate this change and minimize any losses that do occur through good injury management and claims management efforts.

Wednesday, June 24, 2009

Looking for Trouble: Finding and Correcting Mod Errors

View the full blog at http://www.workcompedge.com/blog/blog.cfm

Today's blog will be most useful to insurance agencies who are assisting their clients with experience mod verification and analysis, but the main point is important to agents and employers alike: sometimes errors in the mod occur, and these errors can cost the employer money through increased premium costs. Therefore it's important to go "looking for trouble:" to know how to identify such errors, and how to get them corrected.


Both data reporting and, less frequently, calculation errors can impact the mod - and the amount of premium that an employer must pay. Checking for and questioning such errors can save an employer money!

http://www.WorkCompEdge.com
http://www.SpecificSoftware.com

Wednesday, June 10, 2009

Why Invest in Safety?

Listen/subscribe to this blog on the WorkCompEdge podcast feed

Editor's note: I recently joined the Small Business Online Community sponsored by Bank of America. Among several interesting articles there, I was thrilled to find a safety guy talking about the workers comp mod. Robert F. Tilley, Jr. is the CEO of SafeTek USA, a company that provides knowledge, supplies, products and services to North American organizations ranging from small residential builders to the US Navy. SafeTek's vision - "to help create safe and healthful workplaces, where quality is higher, mistakes are fewer, and costs are lower" - is quite similar to the mission of WorkCompEdge, and Robert's article certainly has some points that should sound familiar to our regular readers. But he also brings the perspective of a safety professional and the business owners his company serves - along with some interesting statistics. The following article may give your company's management, or your clients, some new food for thought.


At a recent speaking engagement for business owners addressing how to implement effective safety programs, I had a question from a member of the audience-we'll call him Bob. Bob asked why he should invest in safety. He told me he has insurance if an employee gets injured, he has a safety manual, OSHA has never bothered him and the only employee injuries so far have been minor. Why should he do more if what he's doing now is working?
"Well Bob," I said. "How much will it cost your business if an employee falls from a roof, and how much have those ‘minor injuries' cost you so far?" Needless to say, Bob, and everyone else in the audience that day, were quite surprised as we revealed the actual costs of workplace injuries to their businesses. Unfortunately, the only thing most employers are aware of is that they have to spend money to have an effective safety program, and that's where the train stops. Successful companies, however, maintain very effective safety programs and pay the expenses involved even when business is slow and times are tough.
Most employers maintain some semblance of a safety program at their company, either because they care about their employees or because they're required to by OSHA. OSHA violations can range anywhere from just a warning, to $70,000 per incident with recent proposed legislation asking to raise fines even further into the range of EPA violations. I would like to think that all employers care about their employees, but often profits come first. What does that mean? It means one thing is certain-all employers care about their company because of the profits derived from it. A for-profit business is created to make a profit 99.9 percent of the time. You carry insurance to protect yourself and your business, you plan ahead to avoid unforeseen costs and cut expenses where they are not needed to ensure you are as competitive as possible while maintaining a good profit margin.
Unfortunately, however, the cost of effective safety measures are all too often deemed an "unnecessary" expense. When business is slow, what is the first expense to get to get cut? You already know: the safety program. Normally the responsibility gets transferred to the HR manager, and training and other expenses are cut, which could really lead to disaster, especially for the new employee you just hired. If you are not motivated to have an effective safety program by either OSHA, the threat of fines or care for your employees, one thing that will motivate you is the actual cost of a workplace injury to your business. So how much does it cost?
Statistics and Costs
Every year in the United States there are over 6,000 workplace fatalities. The greatest majority of these fatalities are men ages twenty-five to forty-four, of which there are approximately 30 million in the United States. That means, using this example, just over 1 in every 6,000 men aged twenty-five to forty-four dies at work each year.
Even with these staggering numbers, this does not include deaths related to occupational illness. Another 50,000 workers die every year in the United States from occupational illnesses due to exposure to a workplace hazard. These occupational illnesses include asbestosis caused by exposure to asbestos, silicosis which can be acquired from concrete cutting operations (and any work involving exposure to crystalline silica dust if not using proper respiratory protection) black lung disease for miners, or brown lung disease for textile workers, etc. (Just an FYI, though not usually fatal, poison ivy is an OSHA reportable illness.)
In addition to deaths, there are over 6 million U.S. workers that suffer non-fatal workplace injuries with an estimated cost to U.S. businesses of around $128 billion annually. A person's life or health is obviously priceless, but incidents and injuries carry a tangible cost to business, one quarter of each dollar of pre-tax corporate profits, to be exact.
The actual cost of a workplace accident or illness to your organization depends on a few different things. Costs depend on how many employees you have, how many incidents you have, the type of work you do and the value of your materials, products or services. For companies that may be experiencing a tough time financially, any losses are serious. Even for a large employer, losing an employee on a job who is skilled in their trade, for even a few days, can have a much larger impact on profits than the actual direct costs might suggest. With smaller businesses this would be magnified because they often have very little buffer when it comes to accidental losses. A serious incident could not just make it difficult to get by, but put them out of business. In fact, according to a recent study, 60 percent of companies experiencing a serious disruption that lasted more than nine days went out of business.
"But Wait, What about My Insurance? Isn't My Business Covered?"
Insurance only covers what is detailed in the policy, and it usually only pays for serious injuries or damage. Workers' compensation does cover all employee injuries, but you will end up paying for the cost of that injury and more-we'll get into that later. Some of the costs that are not covered by insurance include lost time, sick pay, damage or loss of product and materials, lost time and failure to keep schedule, extra wages for overtime and temporary labor, investigation time and expenses, OSHA fines, loss of contracts, legal costs and loss of company reputation, to name a few.
The uninsured costs differ between businesses, the type of work being done, insurance and type injury. No matter how you look at it, though, the uninsured costs are many times greater than the insured costs. If your business is a ship, costs are like an iceberg. Most of the costs are hidden beneath the surface and are not immediately visible, but you feel it when you run into them. Studies have shown that the insurance premium to uninsured cost ratios for the construction industry generally range from 1:9 to 1:41. That means that for every $1 paid in insurance premiums, the company has to pay an additional $9 to $41 themselves for losses arising from incidents. Another way to look at it-uninsurable expenses often run up to as much as 4 times more than the actual costs covered by insurance.
Workers' Compensation Insurance
It may surprise even the financially savvy how much you can save on your insurance by being safe. A poor claims record will affect the amount a company pays in insurance premiums. Depending on the number of incidents a company may have, insurance premiums can increase, and coverage may even be cancelled. Insurance companies set a base rate for a particular industry, and the number of incidents you have directly affects how much you pay as your base rate. This is called an experience modifier. Your workers' compensation insurance premium is determined by this easy formula:
Payroll x Workers' Compensation Rate x Experience Modifier
Workers' compensation rates reflect the average claim cost per $100 of payroll. Workers' compensation rates can take a huge chunk out of your profits if you are not safe. The average worker's compensation rate for construction is 7 to 8 percent of your payroll, but can be lower for executives, around 2 percent, or 25 percent for more high risk activities. According to the U.S. Census Bureau, construction claims comprise around 21 percent of the total claims for all industries. This is quite a large number considering that only 5.7 percent of the U.S. workforce is in the construction industry.
An experience modifier of 1.0 means your company's workers' compensation claims experience is no better or worse than your industry. If you have a lower experience modifier, you pay less.
For example, if your business had a 1.47 experience modifier because of increased incidents and injuries and paid $85,958 in premiums, but reorganized, got serious about safety, and got down to a .82 experience modifier, your business would only be paying $47,950. That is almost a $40,000 savings. That $40,000 with a 9 percent profit margin equates to approximately $445,000 in new business each year!
There are other savings to be had. Many businesses find that by improving workplace safety and health standards, their investments are repaid by improved productivity and efficiency, less employee absence, good company reputation, less turnover and improved quality of work. Tackling the causes of incidents and injuries is not unnecessary overhead, but an investment in your business. An investment in an effective health and safety program is as valuable as any other for your company. The American Society of Safety Engineers found in a recent study that for every dollar spent on a quality safety and health program, businesses saved $8. That's a healthy return on investment.
An investment into an effective safety and health program for your business is just that, an investment. Not only is it unethical to risk an employee's health or safety to save money and cut costs, but in reality, it does just the opposite. It creates unnecessary risks, costs and headaches. A safe company with limited incidents and injuries will not only have an increased profit margin, but will be more appealing to potential clients and good employees. Successful businesses plan for the future, for growth and for potential risks. Safety should play a key role in your strategy and is the reason long-term successful businesses invest so much into their safety and health programs, because as I am sure some of you know, gambling isn't a good long term, or short term investment. Play it safe with safety. You may skimp by for a while, but the house always wins.

Listen/subscribe to this blog on the WorkCompEdge podcast feed

http://www.WorkCompEdge.com
http://www.SpecificSoftware.com


If you are not motivated to have an effective safety program by either OSHA, the threat of fines or care for your employees, one thing that will motivate you is the actual cost of a workplace injury to your business.

Wednesday, May 27, 2009

Member Agencies Talk About WorkCompEdge

Maybe you're in an agency that's considering WorkCompEdge. Or maybe you're already an agency member. Integrating WorkCompEdge into your sales and service processes is admittedly a task that takes some thought and - that dreaded word - change. WorkCompEdge member Garry Watts of the Winona Agency acknowledges it isn't easy. "I'm a producer," he says, "and we don't think 'process-oriented.'" But, in a new audio interview available here on our corporate website and as a podcast feed, Garry also goes on to offer encouragement for - and his experience with - implementing WorkCompEdge.
Today's blog marks the first time we've published the blog as a podcast. Would you like all WorkCompEdge blog entries delivered as a podcast? Let us know!

"WorkCompEdge seemed to be a missing link for us," he says. "We think the return on investment is very high."

WorkCompEdge contributor Frank Pennachio, another agency owner and work comp trainer, also lends his thoughts on how WorkCompEdge helps agents lead and engage employers and how various work comp training programs integrate with WorkCompEdge.

(For our Member Agencies, Frank and Garry will be continuing this discussion in more depth in a web-enabled roundtable discussion in July - watch your inbox for more details.)

Thanks to Jack Burke, president of Sound Marketing and host of the popular insurance programs "Audio Insurance Outlook" and "Insurance Talk Radio," for conducting the interview.

For you podcast subscribers out there, this blog marks the first time we've pushed audio to a podcast feed. Be sure to subscribe, and let us know if you'd like all blogs available as a podcast! It won't always be Jack's professional voice, but we're willing to give it a try if the interest is there!

Play the audio interview now

Subscribe to the WorkCompEdge podcast feed

http://www.SpecificSoftware.com
http://www.WorkCompEdge.com

WorkCompEdge Interview with Garry Watts and Frank Pennachio

Jack Burke, president of Sound Marketing and host of the popular insurance programs "Audio Insurance Outlook" and "Insurance Talk Radio," interviews WorkCompEdge member agents Garry Watts of the Winona Agency and Frank Pennachio of WorkComp Partners about the challenges and benefits of integrating WorkCompEdge into their agency processes.

http://www.specificsoftware.com/
http://www.workcompedge.com/

Wednesday, May 13, 2009

Virtual Conference on Return to Work Now in Progress

Workers compensation consultant, writer and trainer Margaret Spence of Douglas Claims and Risk Consultants has founded National Return to Work Week and is observing it now (May 11-15, 2009) for the first time with a free virtual conference. Here are a few of the seminar topics coming up in the remainder of the week:

  • Physician Where Art Thou - Medical Management
  • Best Practices - Workers Compensation and Beyond - From a Defense Attorney’s Point of View
  • I'm Injured and I Can't Come Back to Work
  • Engaging Employees With Disabilities - Getting Them Back to Work


No packing needed - attend the inaugural conference for "National Return to Work Week" virtually. And free! And even after it's over!


"Kory," you might say, "it's a whole week of free events. And this is Wednesday afternoon. Why didn't you tell me about this sooner?"

"Well," I would say sheepishly, "that might have something to do with me not opening every email I receive in the most timely manner. Not yours, of course."

But all is not lost! The seminars we've missed are recorded and also available. These include:

  • Disability is a Daunting Task - Right?

  • The Flip Side: Attorneys and Return to Work

  • Vocational Retraining: a Viable Return to Work Option

and many more. Speakers include attorneys, an ergonomics specialist, a medical doctor, human resource professionals, Ms. Spence, WorkCompEdge contributor Frank Pennachio, and others.

Visit
www.brighttalk.com/summit/nationalreturntoworkweek to view in-progress, upcoming, and recorded sessions. Registration is free and easy. I had a little trouble the first time I tried to view one of the seminars (my browswer bombed), but on my subsequent attempt, everything worked fine.

This initiative mirrors many of the principles we advocate in WorkCompEdge, and we congratulate Ms. Spence on her leadership and vision.

http://www.WorkCompEdge.com
http://www.SpecificSoftware.com